Reports
Use this function to generate incident reports.
|
2.
|
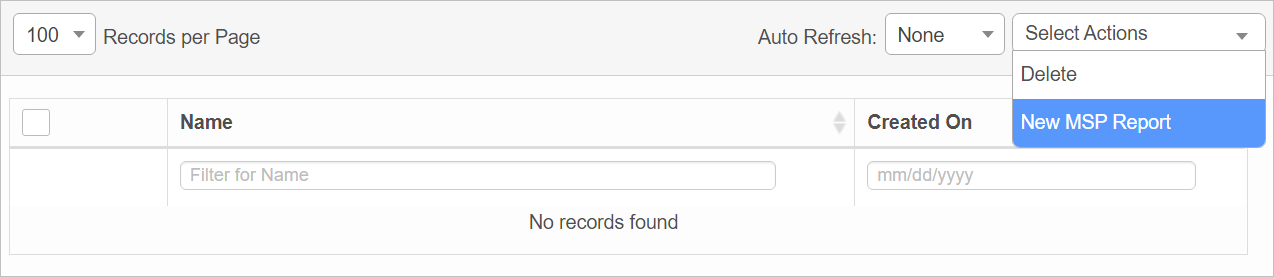
On the Home page, click Reports. The Report page displays. |
|
3.
|
From the Select Actions drop-down list, choose New MSP Report. The New MSP report page displays. |
|
4.
|
Enter a Name for the report. |
|
5.
|
Check the Is Private option if the report must be visible for selected users only. |
|
6.
|
To send the report to a user(s), click Add and in the Send Report to dialog box, search for an select the intended recipients. |
|
7.
|
In the Schedule Report Frequency field, click the drop-down list select the applicable frequency (such as every 30 seconds, every minute, etc.). To specify a custom frequency, make selections in the fields such as Seconds, Minutes, Hours, etc.
|
|
8.
|
Specify the Report Properties (refer to the section below). |
|
9.
|
When all selections/entries are made, click Save and Continue. Refer to the Run Report section below. |
Report Properties
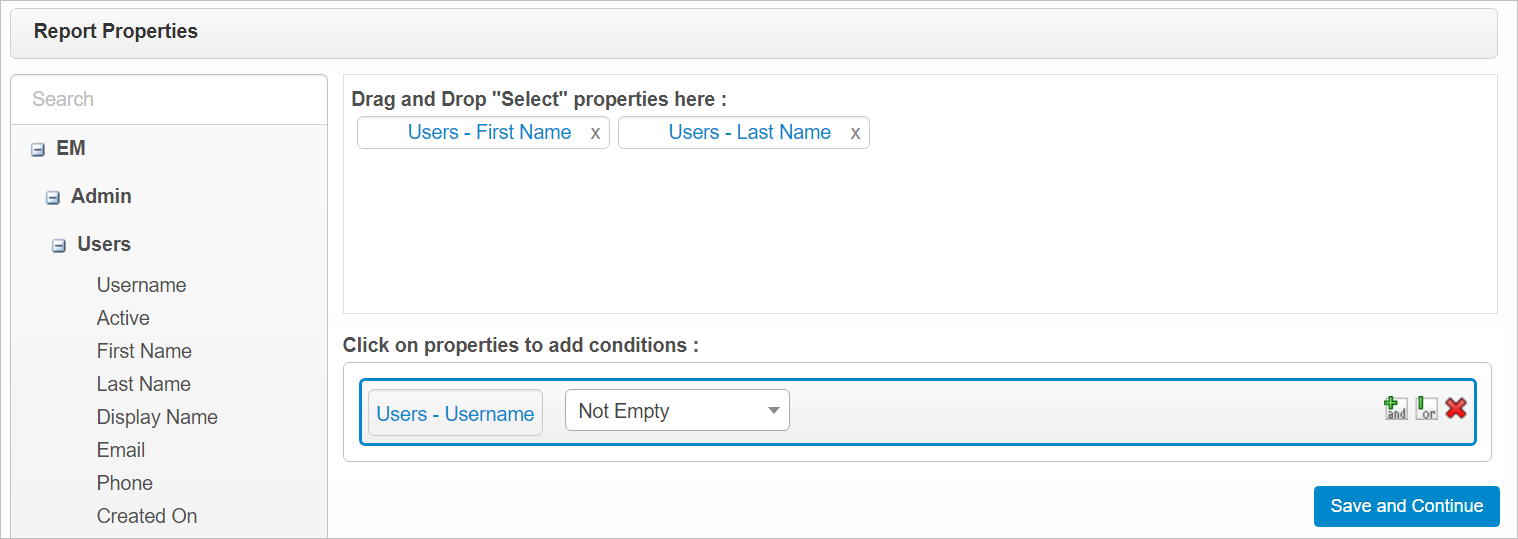
In the example, above, a report will be generated that contains the First Name and Last Name for record that has a Username.
|
1.
|
In the Search field, begin typing characters until the applicable property is found OR expand the available sections. |
|
2.
|
To select properties to include in the report: |
|
a.
|
Locate the property in the list on the left. |
|
b.
|
Click and drag it under the heading, "Drag and Drop "Select" Properties here." |
|
c.
|
Continue selecting the additional properties necessary. |
|
3.
|
To add conditions to apply to the property: |
|
a.
|
Click the property in the list on the left. The information is automatically populated in the section on the right. |
|
b.
|
In the variable field, click the drop-down list and select the applicable parameter (such as "Not Empty"). |
|
c.
|
To add additional conditions, click the plus icon. |
|
d.
|
To edit an existing condition, click the paperclip icon. |
|
e.
|
To delete a condition, click the red X. |
Run Report
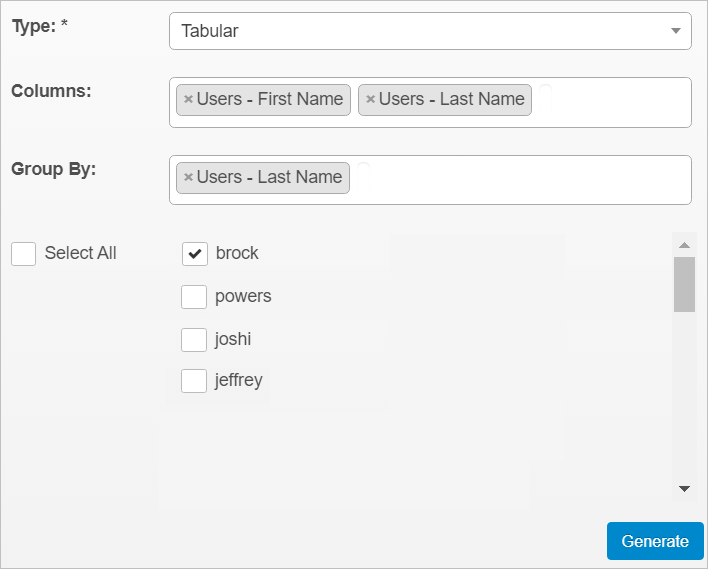
Once the report frequency, properties and conditions are specified, and that data is saved, the Run Report page displays.
|
1.
|
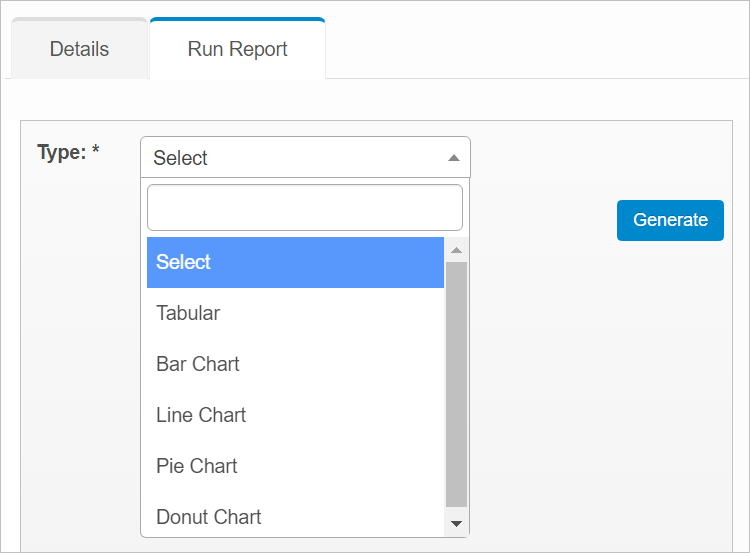
In the Type field, select the graphical representation of the report: |
Tabular
Bar Chart
Line Chart
Pie Chart
Donut Chart
|
2.
|
In the Columns field, select which information you want displayed in the report columns. |
|
3.
|
In the Group By field, select how the data should be grouped. |
|
4.
|
In the list of names, select those to include in the report. |
|
5.
|
When all selections/entries are made, click Generate. The window refreshes and displays a report matching the selection criteria. If not report is shown, modify the previous selections. |
|
6.
|
From the Select Actions drop-down list, select any of the following actions: |
Export. Exports the configured Report(s) in Excel file format. An email with the attachment is sent to the logged in MSP Vendor.
Publish. Displays the report on the Dashboard for the MSP Vendor.
Save as Image. Saves a graphical representation of the report in Image format. Tabular Format report cannot be saved as an Image.
View Data. Displays the data accumulated for the report.